Project information
- Category: Data Visualization
- Technologies: Django, Grafana, AWS (EC2, RDS, S3, Glue, Athena), Plotly.js, React, Docker
- Project date: October, 2020
Description
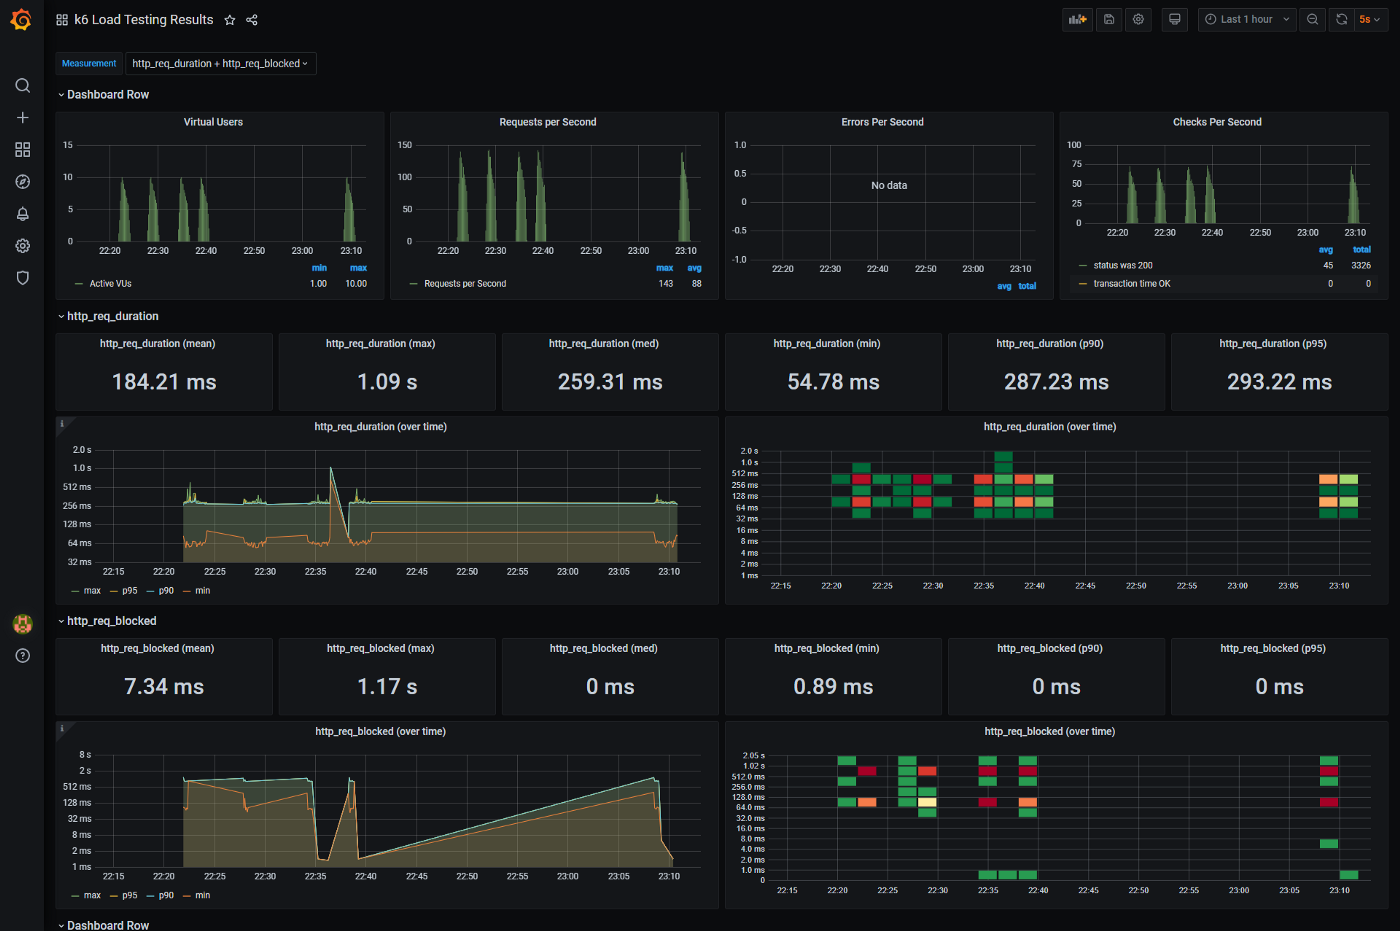
It is a Grafana based data analytics tool which queries data stored in AWS postgres database and/or S3 buckets.
The graphs and plots can be customized by the users.
The users can create their own queries for the specific variables they require. The database in S3 bucket is transformed and indexed according to timestamp so that the query would not have to scan the entire database thereby optimising the time and reducing the cost of the service. The tool would enable engineers and stakeholders alike to assess the health of the entity that is producing the data.
